Trading Basics: Price Levels
Price Levels
Price levels (or area of value) are lines on the chart and the price reacts to these lines. The lines can be drawn based on historical prices, so-called trendlines, or based on psychological levels (people tend to make decisions at round prices) or averages (EMA - in this case it can be a curve).
The price is expected to bounce from these levels or break over the level. If the price breaks the level than the level could not be held, and the price will probably go in the opposite direction or even break the trend.
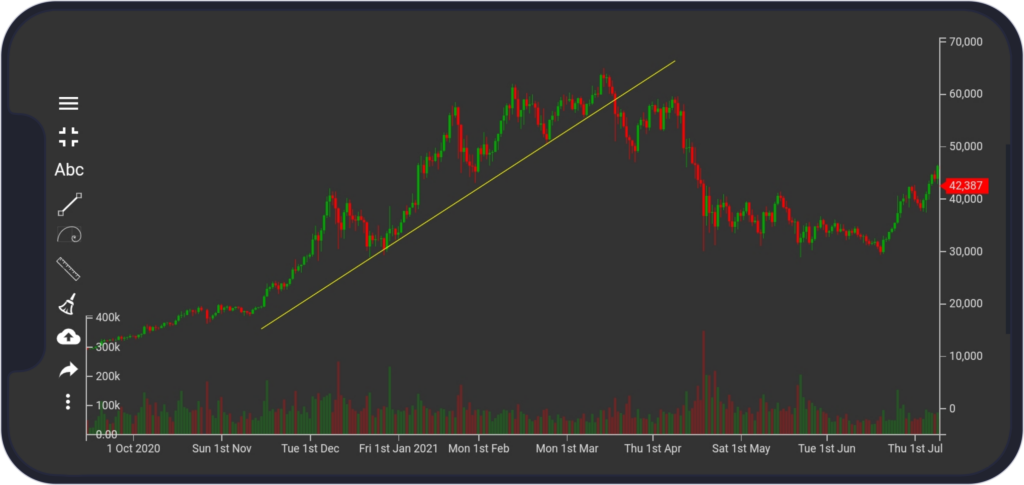
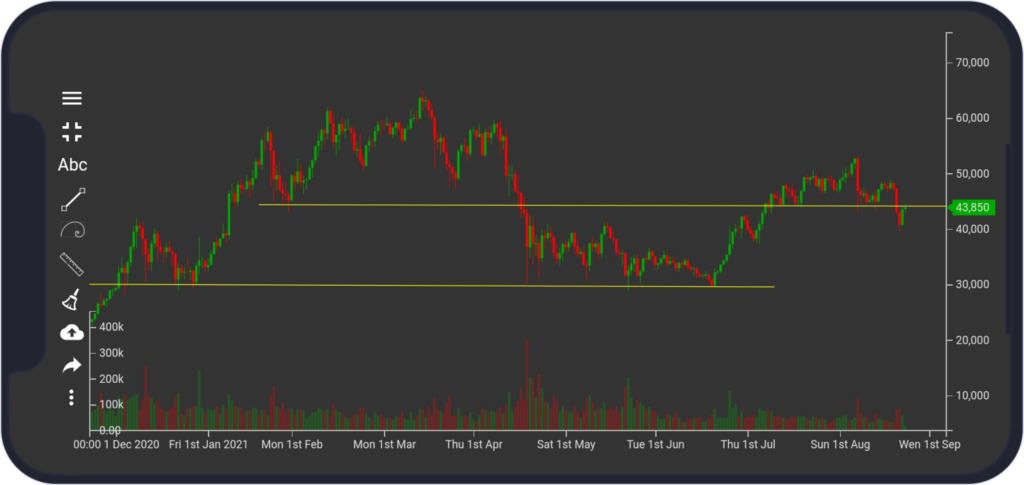
In the image, the trendline (the gold line, or also so-called support) was tested four times and the market got exhausted around level $60 000 USD (from 1st of Jan to 1st Apr 2021), ultimately breaking the trendline, forming lower high and lower low, and the move to the downside begins, breaking several lows and starts consolidating around level $30 000 USD.
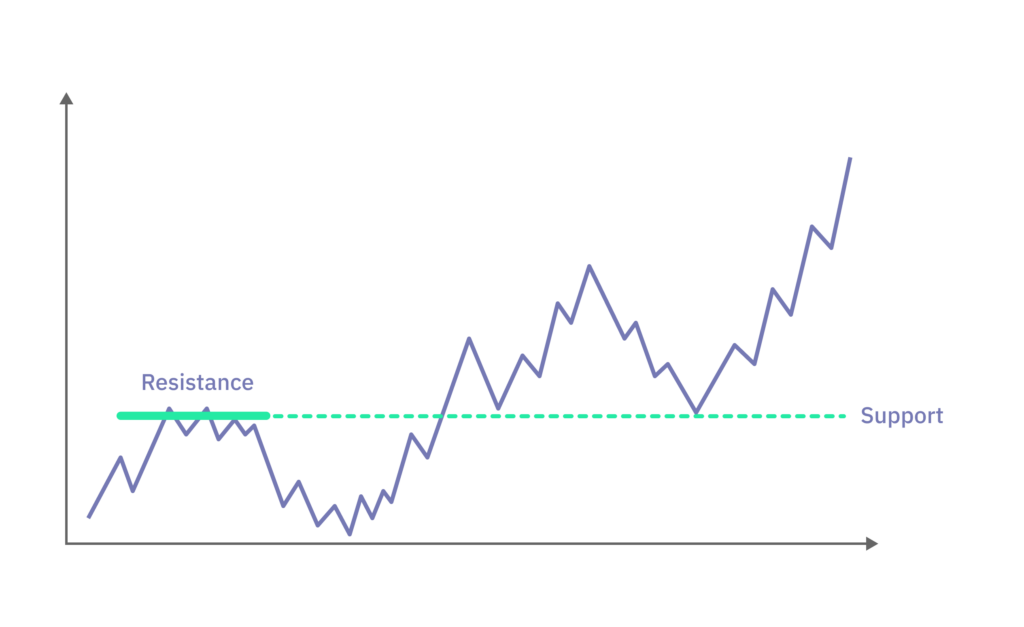
Price levels are referred to as support and resistance. If the price is in a downtrend and the trend pauses because buyers come in, this is called support. If the price is in an uptrend and the trend pauses, this is called resistance.
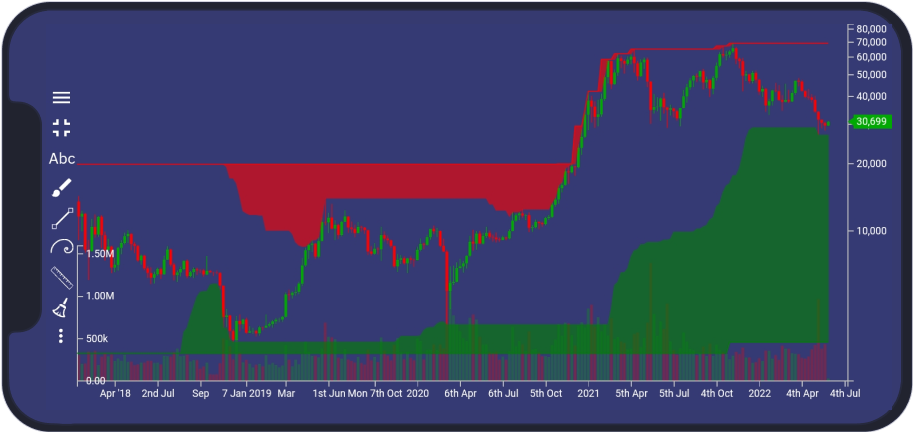
In the image, the resistance (red area) around level $20 000 USD holds up to the point when the resistance is broken in November 2021.
It is important to mention that traders should backtest each indicator and its levels, whether it gives good results on their market, because some levels work well on some assets and market types while others do not.
There are many indicators, which can help traders to define these levels. For example:
Previous highs / lows. Every high or low can signal either continuation of a trend, consolidation, or a pull back in a trend or a reversal of the trend. If the asset is forming higher highs and higher lows, it signals an uptrend and vice versa for the opposite direction - lower lows and lower highs signals a downtrend.
Breaking higher highs and higher lows (or lower highs and lower lows in a downtrend) can signal a consolidation/pullback in a trend or reversal. Therefore, price often reacts to these levels. Note, the indicator is called raw market movement or zig zag.
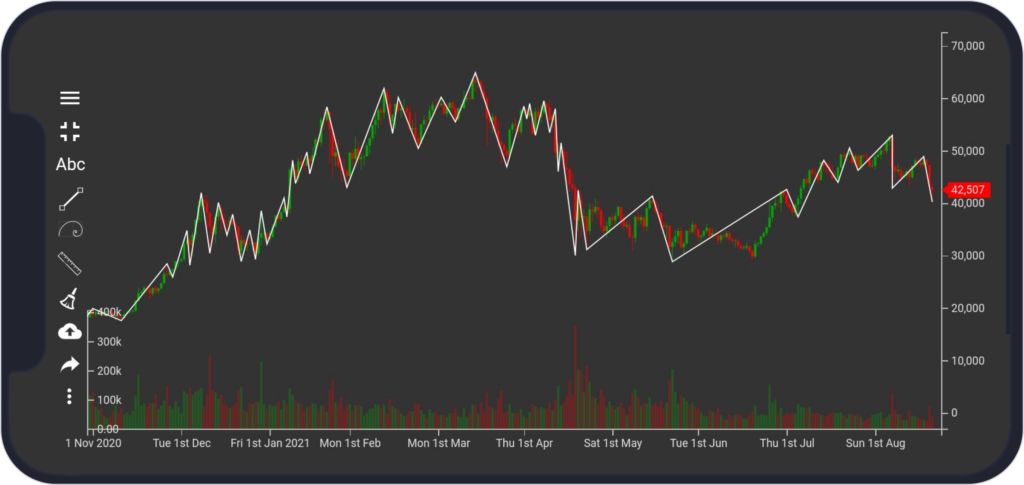
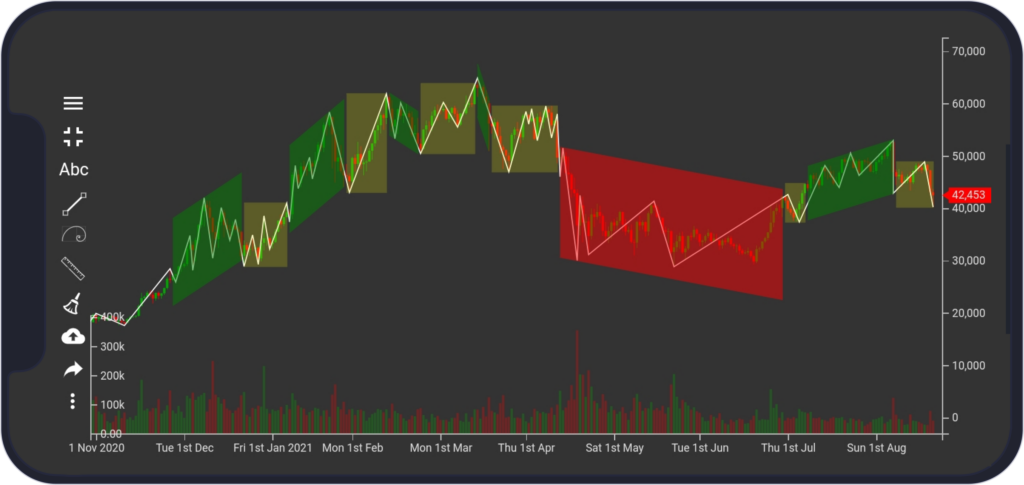
In the image, the uptrend is drawn as a green rectangle area and is drawn when the asset is forming higher highs and higher lows. If the rule is broken, a yellow rectangle area is drawn which means the trend can change and the asset is probably in consolidation. Vice versa for the downtrend.
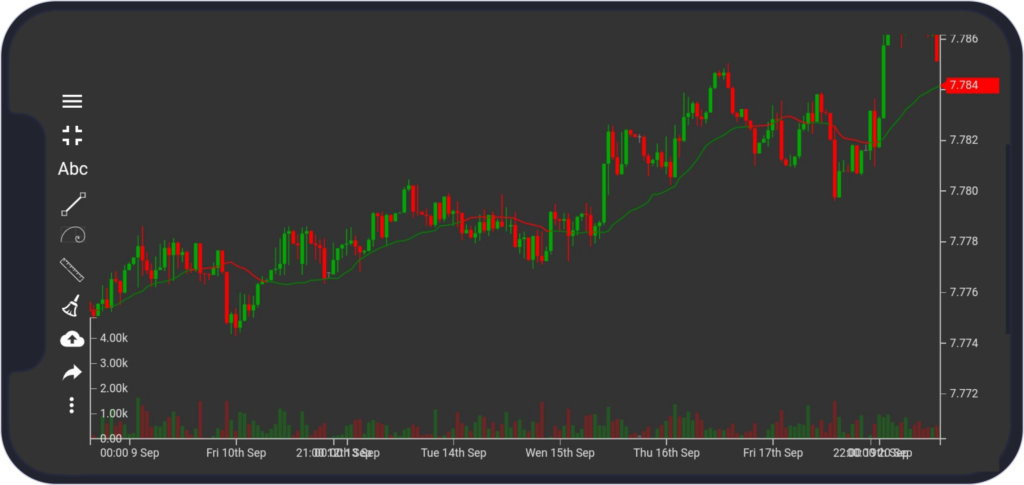
EMA. Simple moving average (SMA) or exponential moving average (EMA) with periods 20, 50, 100, 200, 300 represents an average value, which is a price level. Traders are advised to try other periods such as 16, 60, 150 etc., which may work better depending on the market. For example, a trader enters at the price of EMA with period 200 and expects a bounce from this level towards his or her trading direction.
Note, the unit of period depends on the time frame, for example period 20 on the 1h chart means that the EMA value is the average value from the last 20 hours.
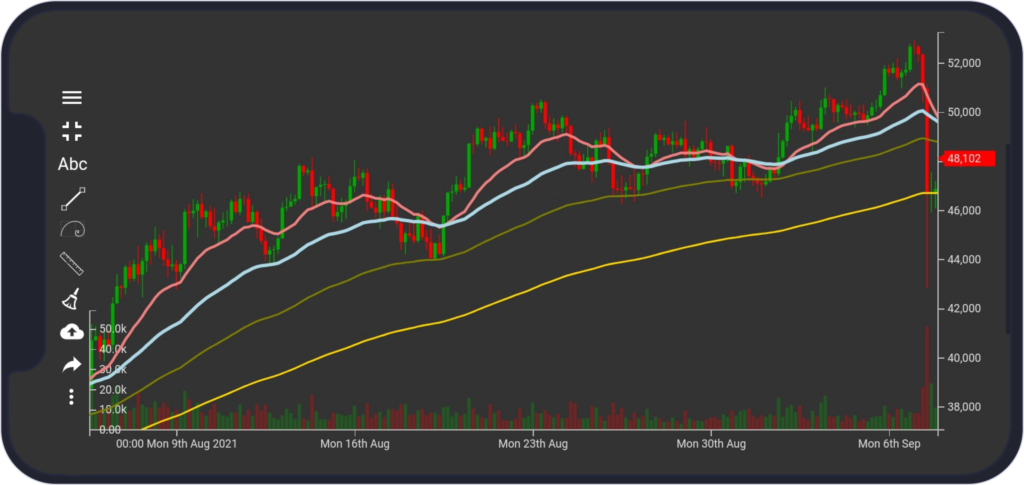
In the image, the gold line is EMA p=200, olive line is EMA p=100, light-blue line is EMA p=50 and pink line is EMA p=20.
High-volume levels (PBV). PBV is another chart plotted on top of the candlestick chart, and it sums volumes for each price level, and these levels are plotted horizontally on the chart.
Price reacts to high-volume levels because traders were willing to buy or sell at those prices, and it is expected that they buy or sell again at the same price levels, and as a result, these levels hold.
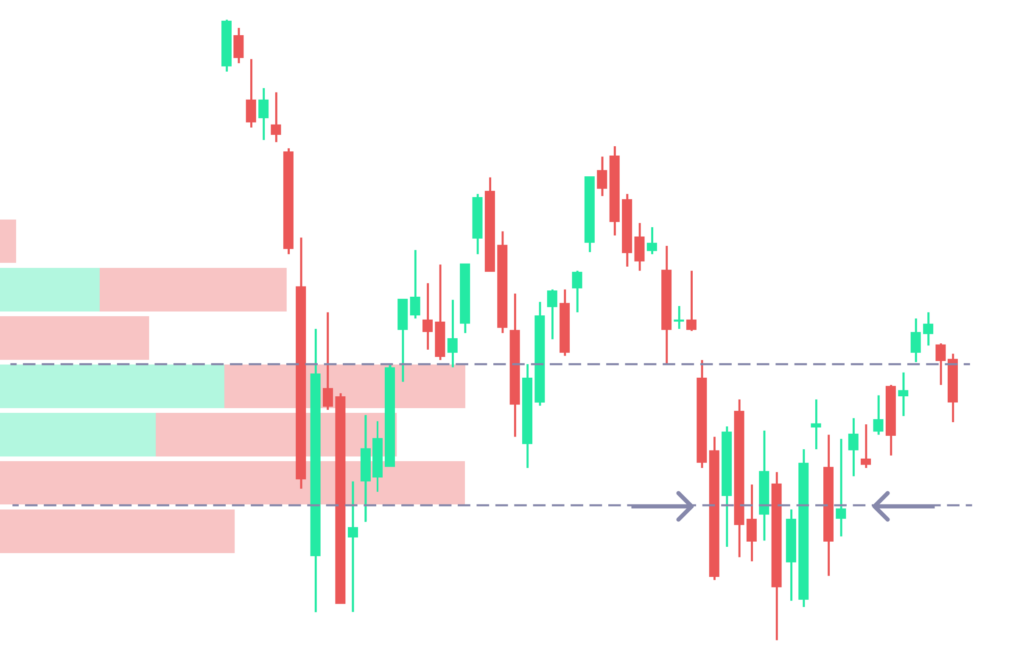
In the image, the price reacts to the level where previously there was high volume.
Fibonacci retracement / extension.
Fibonacci retracement in a trend gives levels where the price reverts in a pull-back and continues in the direction of the trend.
Fibonacci extension gives levels where the price may be headed.
Fibonacci is always drawn from low to high or high to low, revealing levels of retracement or targets (extension).
Fibonacci tools are used by many traders who can move the price to your trading direction if they are buying/selling at the fib level.
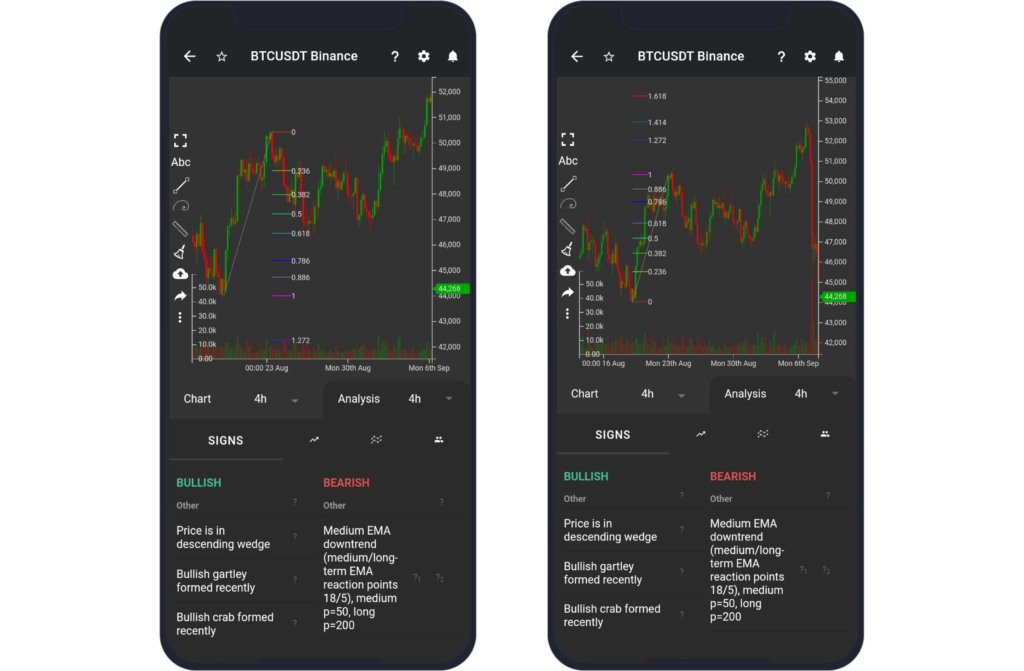
In the image, the fib retracement is drawn from the low of $44 000 USD to the high of $50 000 USD, and the price retraced at the fibonacci level of 0.618.
As can be seen from the image above, the Fibonacci was drawn from low $44 000 USD to high $50 000 USD. The 1st level of $53 000 USD which is 1.414 fib extension, and the 2nd level fib extension 1.272 where the price reverted (1st) and reacted (2nd).
Psychological levels (Quarters theory). Rounded prices are psychological, such as 100 or 1000 or 0.1 and it is expected that the price reacts to these rounded levels.
Trendline. Trendline is a line or area, where price can bounce away or break through and with each bounce from the trendline, it is weakening and it is just a matter of time when it will break. Traders can bet on that the price will bounce again and trade the bounce or they can see a weakness in the market and expect the price to break through.
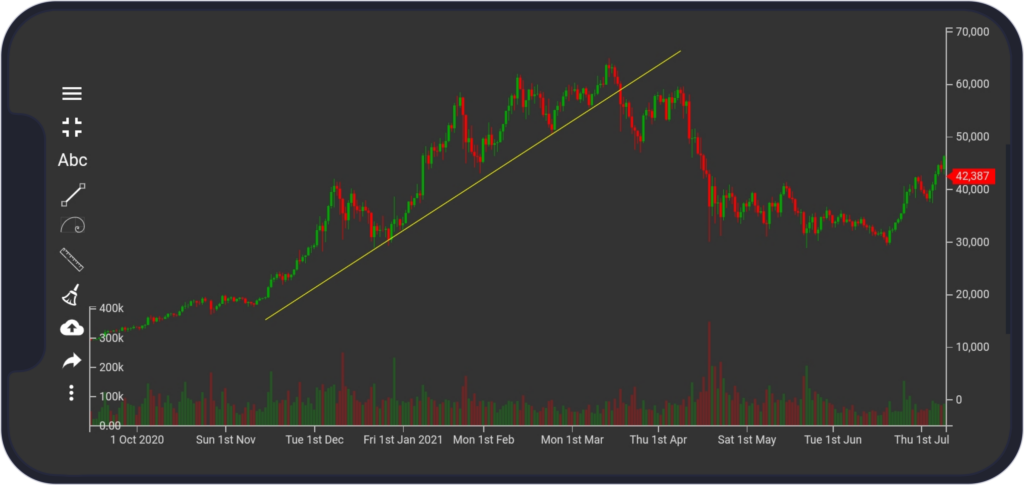
In the image, the trendline (the gold line) was tested four times and the market got exhausted around level $60 000 USD (from 1st of Jan to 1st Apr 2021), ultimately breaking the trendline, forming lower high and lower low, and the move to the downside begins, breaking several lows and starts consolidating around level $30 000 USD.
Upper / lower channel lines. As with trendlines, if the price is trapped inside of a channel, it is expected that the price stays within the channel for a while (channel is a pattern where price stays inside of two perpendicular lines for some time, so-called upper and lower channel lines). Note, each bounce from the upper / lower channel line signals that the line is weakening.
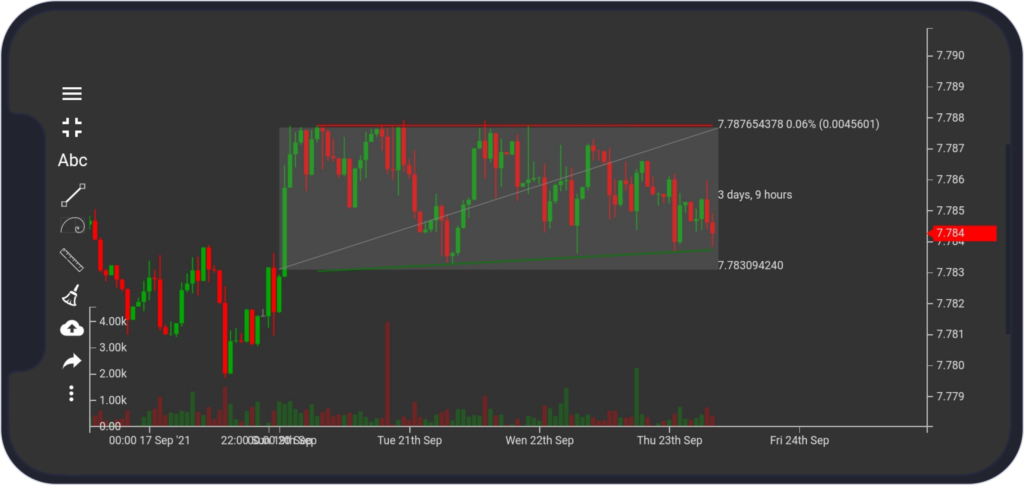
In the image, the channel can be seen inside the green (lower channel line) and red lines (upper channel line).
Moving Volume Weighted Average Price (MVWAP). MVWAP/VWAP is commonly used to find a daily average value (if p = 24h) of the asset, the difference from other averages is that this one also uses volume, not just the price, to calculate the average. The price, therefore, often reacts to this level - or move around this level.
As can be seen from the image, the price reacts and forms support if the price is above and resistance if the price is below MVWAP.
Order book. Orders placed at a specific level or area creating a level, which is expected to be respected. For example, a high volume of buy orders at a level will probably hold the dump or at least it will slow down the dump. Vice versa for the opposite direction.
Traders are advised to be careful when reading the order book, because it is often a subject of manipulation. Anyone can create orders as long as they have funds, but it is not necessary that the orders will be executed and won’t be canceled and used against other traders, which is very often the case. If such orders are placed at a level, it is a false signal that this level can hold but as soon as the price reaches the level, the orders are canceled, and new orders in the opposite direction are created.
It is also important to mention that the levels may differ across many exchanges/brokers - albeit statistically should be the same - therefore traders should check multiple exchanges especially if the asset does not have high volume.
Support becoming resistance or resistance becoming support. If buyers break a resistance and the price returns to this level (of resistance), traders who missed the rise after breaking OR old ones who sold think they made a mistake by selling early, again enter at the same price where they sold, and as a result, the resistance level becomes support because traders start buying at this level. In the same way, as resistance can become support, support can become resistance.
Price Level Strength
In general, there are these rules:
1) the more the level is tested (bounce from the level) over a recent period of time, the weaker it is.
2) If the level was not tested in the recent past, the price is expected to react to this level.
3) Note, also if multiple indicators signal a specific level, then the level is expected to be stronger.