Trading Basics: Momentum
Momentum
Momentum is a short-term signal of strength, e.g., one big candlestick with a big volume. Traders typically want to use the momentum to confirm their hypothesis. It can be found with low-period-value indicators.
Bullish / bearish momentum candlestick patterns. Reversal candlestick patterns or simply big candles towards your trading direction indicate that:
1) the trend is starting to reverse
2) that a whale bought in/sold or both.
It is advised to check lower time frames to exclude the second point, in which case, traders do not want to enter - there should be multiple candles confirming that multiple traders are entering over a longer period of time rather than one big candle indicating one big buy/sell from one trader.
Pattern or trendline breakout. Breakouts (e.g., pattern or trendline) are good places to enter or exit, if the trend continues toward the trading direction, because such moves have strong momentum. In order to find a momentum, pattern or trendline breakout can be commonly found on lower time frames than the one on which the trader is trading.
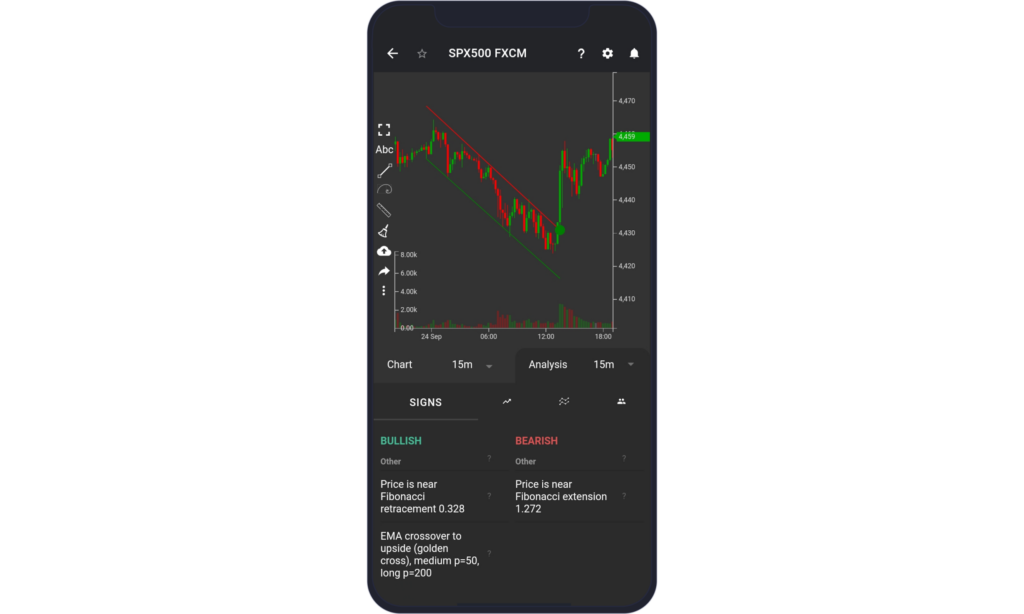
In the image, the price is trading in a channel (green line is the bottom line of the channel or support, and red line is the top line of the channel or resistance). After the channel is broken to the upside, the price increases sharply.
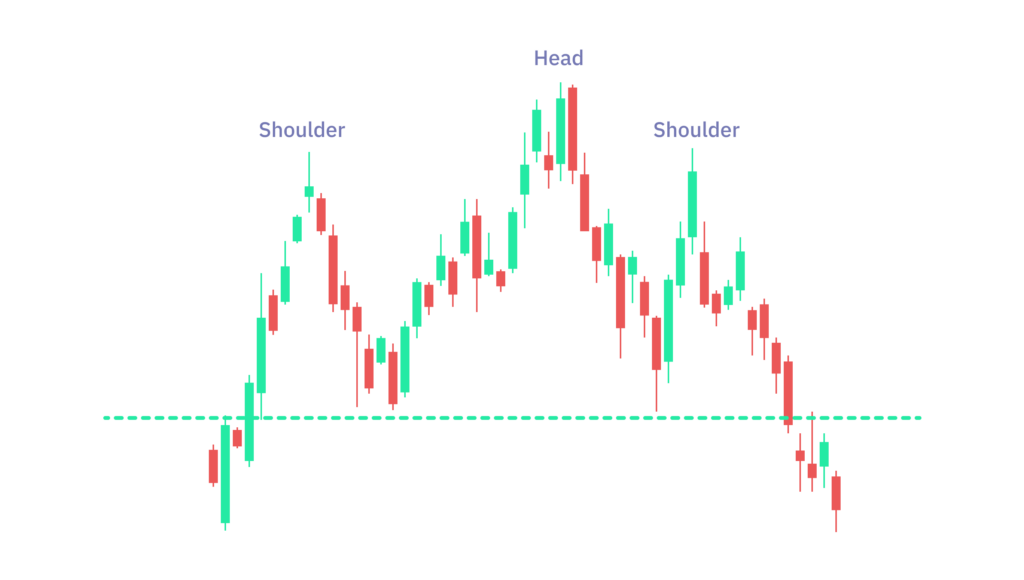
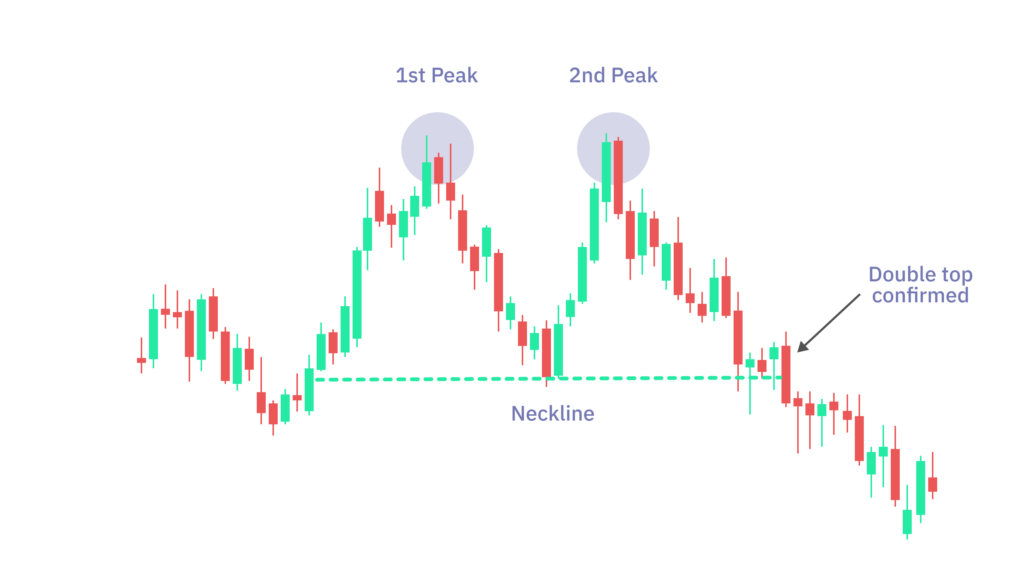
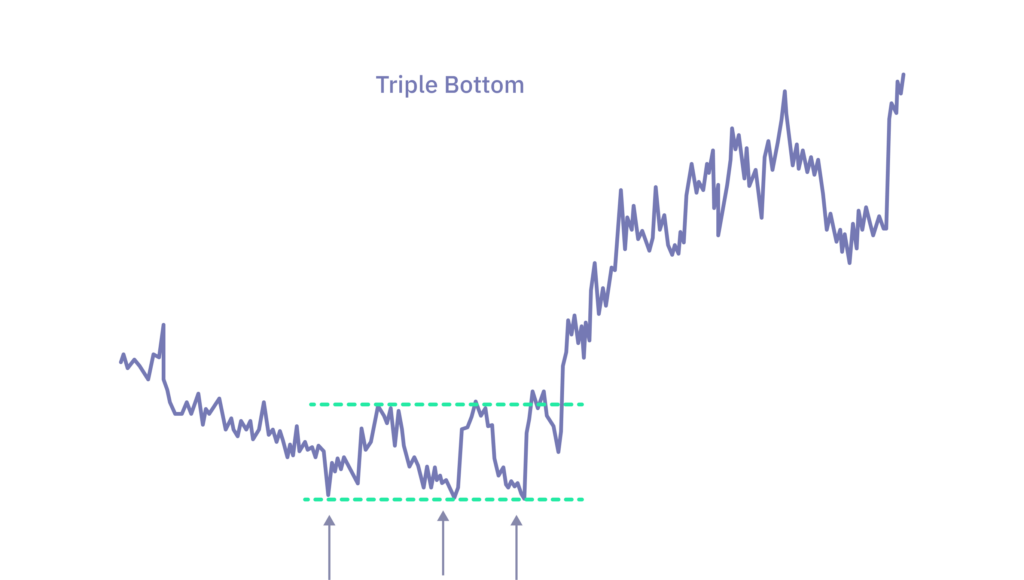
Pattern reversals (head and shoulders, double / triple top / bottom). Pattern reversals, often found on lower time frames, signal that the trend may reverse, because the price cannot break the level and the price reverses to the other trading direction, where it is possible to enter or exit.
BB squeeze. If Bollinger bands (upper one is the red line, bottom one is the green line) are contracting, the volatility is lowering (and usually also there is less volume) and it indicates that a price move (change in price) is incoming, however it does not specify to which direction.
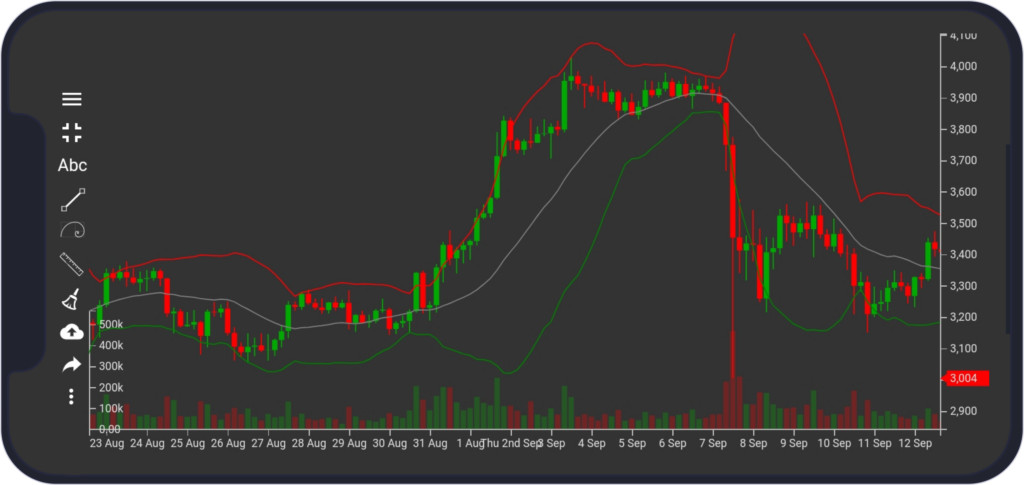
Tip: If BB contract, enter at break out of the previous high or low.