Trading Basics: Market Types
Market Types
Strategies perform very differently in various market types. There is a number of attributes that influence performance of strategies, define a market type, or etc.:
1) market phase (also-called market cycle or market type), can be:
- bull / uptrend (price is rising)
- bear / downtrend (price is falling)
- distribution (price is going sideways)
- accumulation (price is going sideways)
Examples for each market phase (as an option we can put 4 charts side by side for better comparison, indicating each of the phases)
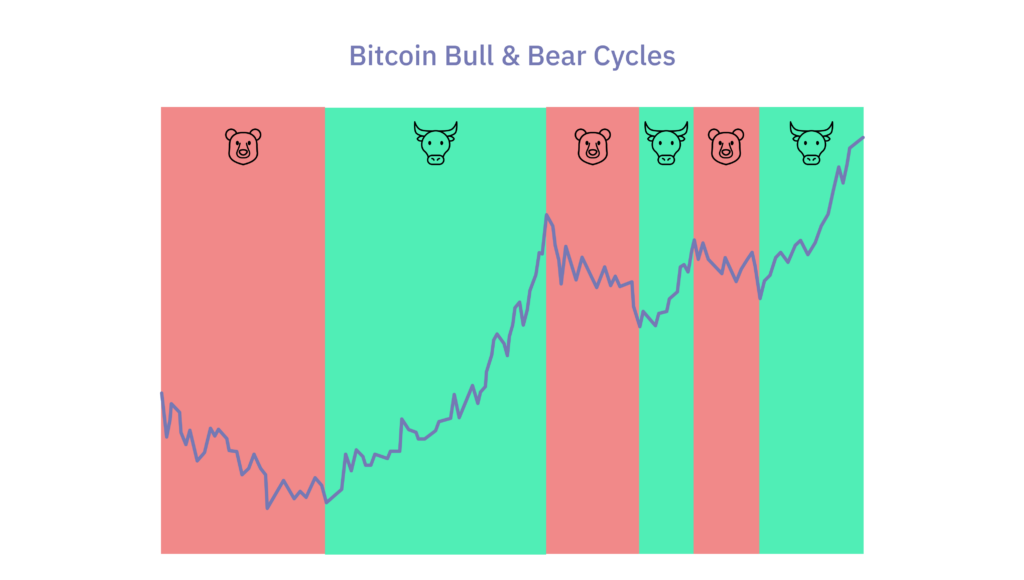

Note, although the price is going sideways in both distribution and accumulation phases, it is important to recognize the difference. After an uptrend ends, the distribution phase occurs and the market is going sideways for a while, and afterwards, a downtrend continues. The same but in the opposite direction happens after the end of a downtrend, the accumulation phase occurs and the market is going sideways and an uptrend continues afterwards. See also the exhaustion and recovery topics in Section Trend Strength.
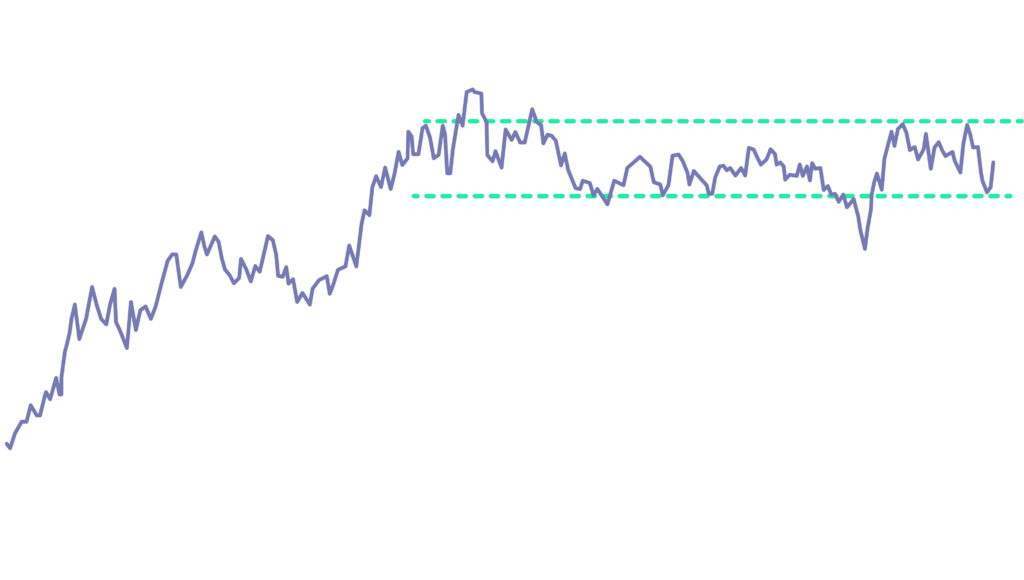
Note 2, it is also important to understand term consolidation. It occurs when the price is trading in a range, so the market is going, again, sideways.
2) volatility (e.g. 1% change vs 10% change a day)
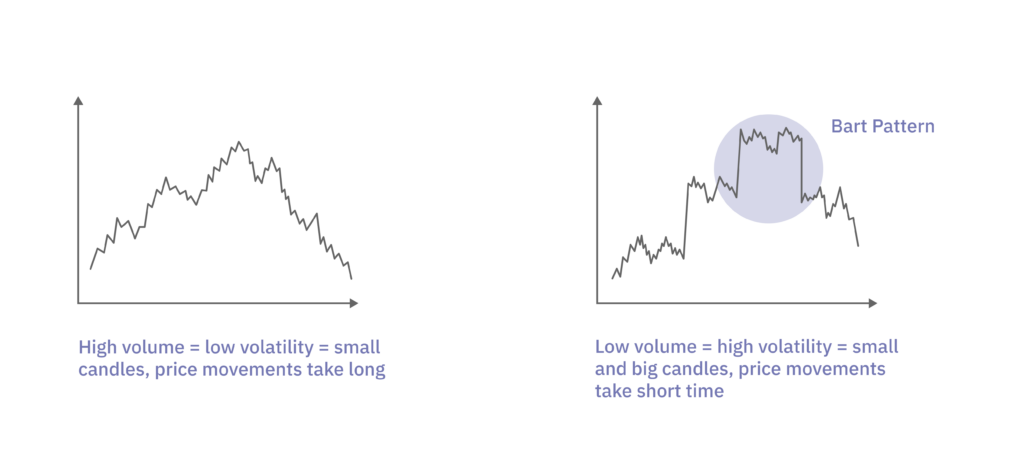
In the image, volatile markets (on the left) have long candles, high (and short) price changes, long wicks compared to the market on the right.
Volatility refers to the fluctuation of the price of a certain asset. It shows how much and how often the price changes. If volatility is high, the price moves quickly and significantly. For example, when some asset (e. g. Bitcoin) experiences sharp high or low price movements up or down, participants of the market react more sensitive – they are more likely to buy or sell this asset in large. This can affect the price so that it can jump very high or very low quickly. In the case of a drastic drop, it brings uncertainty to the market and it scares people.
When the volatility is low, the price is more stable, it doesn't change very fast, and the assets are not so risky.
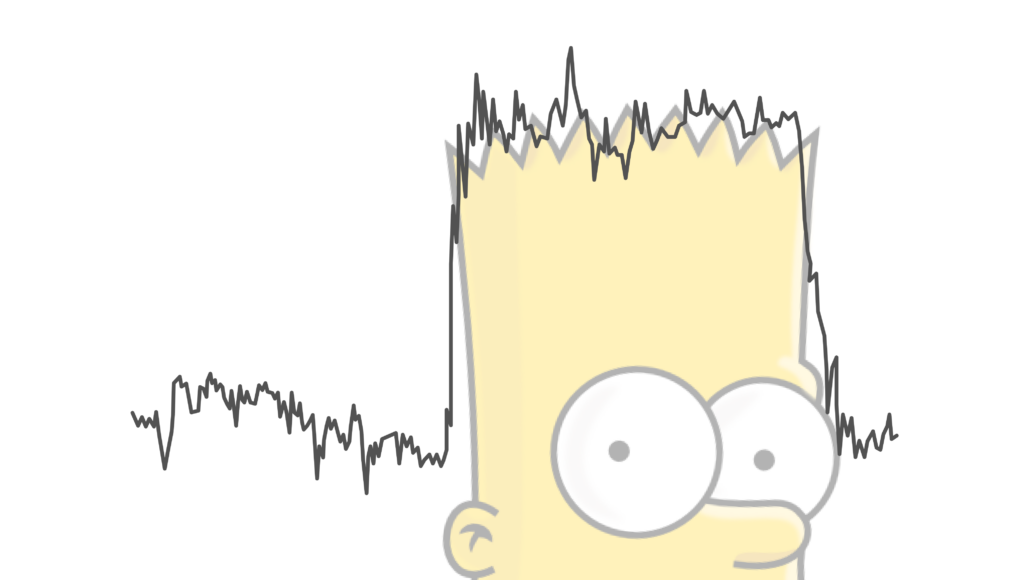
In crypto currencies, we can come across the “Bart Simpson Pattern”. This pattern occurs when an unexpected spike (or a drop) in price is followed by a sideways movement, and subsequently by a sudden drop (or a spike). The chart pattern resembles the shape of Bart Simpson's head.
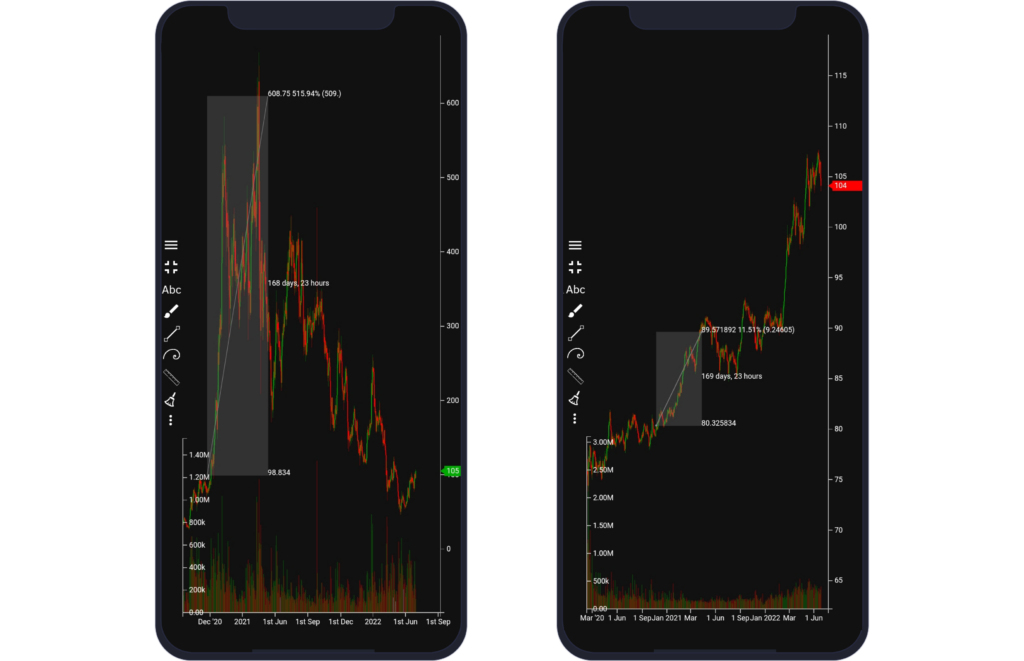
In the picture below, you can see low volatility until 17:00, followed by an extreme rise (probably caused by a whale – a big trader who buys the asset). The price reached approximately $8 200 USD, and it stayed at this level for five hours. At 20:30, the price dropped to the previous level of $7 900 USD, completing the “Bart Simpson Pattern”.
3) volume (e.g. a sudden change in volume, pump ‘n dump scheme).
As a result, it is advised to:
1) make the strategy parameterized to be able to cover multiple market types or phases and
2) test it within various market phases, volatility and volume. Also,
3) do not forget to subtract spread and/or trading fees from the profit (we will cover spread and fees later).
Pair Relationship
Relationships between pairs are important. For example, we could exploit the unlimited-supply highly-inflated USD against finite-supply XAU (gold). USD is diluted and gold is not, therefore the value of gold will rise against USD over time if there is demand.
This relationship might be in our favor in bull markets over the long-term. There are multiple pairs with such a relationship, for example Bitcoin and any fiat currency, such as USD, EUR etc.