Trading Basics: Probability Game
Probability Game
The goal of trading is to outperform markets. This means that a trader should be able to end up with a long-term profit (the goal should be that every month or every other month is profitable for at least an year), which is higher than the profit from holding the asset + salary of the trader. For example, it makes sense to buy / trade only in the case that the trader is able to make profits higher than the average return of an index such as SPX500, which is somewhere around 5-10% yearly.
In order to achieve a statistically-high success rate, traders are looking for a confluence of multiple indicators on multiple time-frames to confirm their hypothesis where the market is heading (or minimize risks). For example, one hypothesis can be that the market will go to the upside. The more indicators there are in a trader's favor (supporting the hypothesis), the higher chance of winning the trader has; because it is more probable that other traders (and especially high-volume traders) trade it as well, and push the price in the trader’s direction.
Obviously, it is not just about count (the number of indicators in your favor) - albeit it may prove to be statistically correct. The trader must understand the complete picture, where the price is going in general. Some indicators just do not work in some markets. The trader must be able to recognize this by backtesting on the specific market they are trading.
Basically, it is a probability game, where traders should be able to identify combinations of indicators - which are forming a strategy (definition from Wikipedia: a trading strategy is a fixed plan that is designed to achieve a profitable return by going long or short in markets):
1) when to enter
2) when to exit and take profits
3) when to stop loss;
And if the strategy is traded, it should give them profit in the long-run on a specific pair or market after subtracting spread (difference between buy and sell price) and trading fees (we will cover spread and fees later).
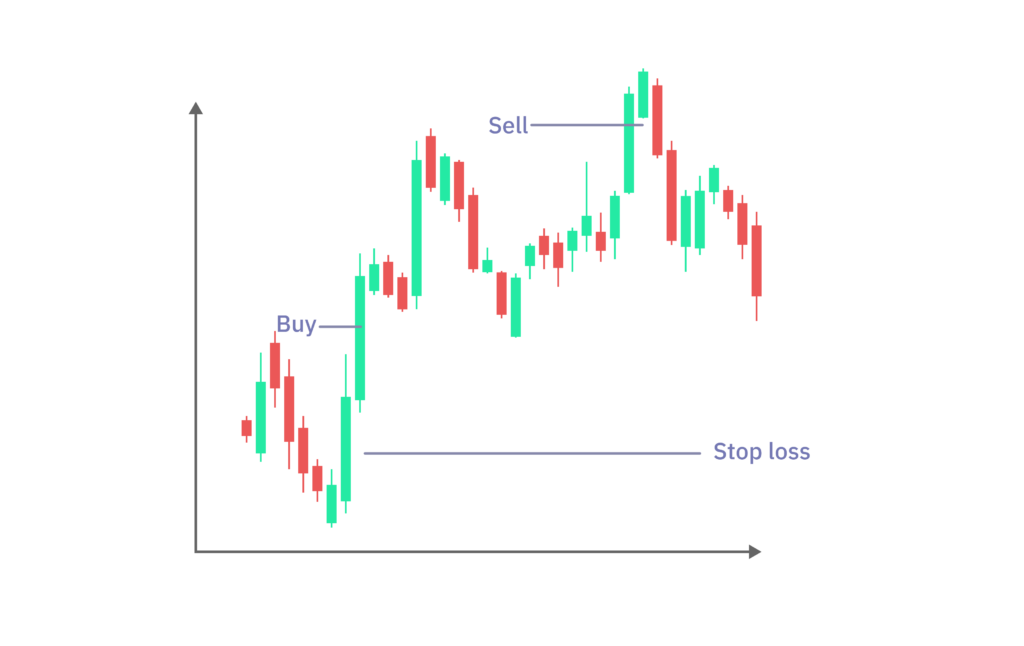
In the chart (above) is set Stop loss order to prevent the loss or secure profit. If the price of an asset fell under the pictured level, the open position would close – assets would be sold for this price. Stop loss is a predefined maximum loss. The interest of traders is to make a profit. That's why they sell assets for more expensive than they had bought them. When a long red candlestick appears, it can be a sign of selling before the price will drop much more, and the potential profit would be less. To make a profit, try to sell above the buy price.