Indicators
Support and resistance
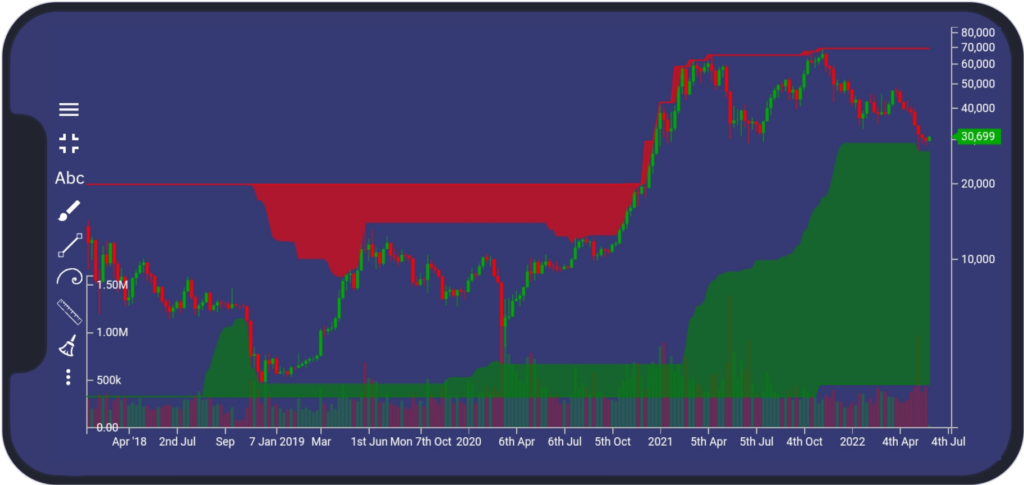
Multiple timeframe support and resistance levels are discovered on two time frames and based on the algorithm for calculating maximas and minimas over the specified period.
The algorithm forms two clouds. The cloud below the price is support and the cloud above the price is resistance. Each cloud is formed by two lines, where it is either minimum (support) or maximum (resistance) over a particular time frame and period.