Why do indicators work in trading?
Indicators help traders with the interpretation of markets. For example, they help to identify trends and price levels (i.e. levels on the chart where the price reacts). They are usually simple and can be calculated with trivial formulas. As a result, indicators are never 100% correct, therefore they should not be used in isolation, but traders should rather find a confluence of multiple indicators, which increases probabilities that the price goes to the expected direction (either up or down).
So – Why indicators work?
First, traders use indicators to make trading decisions in general, which drives the price.
Second, psychology drives the price, including sentiment, fear, uncertainty, and doubt because human emotions influence traders’ decisions, which can be quantified by some indicators.
Third, indicators which are based on statistics and probability work more often.
Leading vs lagging
There are two types of indicators, which are important to recognize. The first is leading indicators and the second is lagging indicators. Although both leading and lagging indicators are based on historical prices, leading indicators attempt to predict price, and lagging indicators assess the current state of an asset but introduce a delay.
The lagging indicators should be used rather to confirm the trading direction, then to enter the market. Note, entering the market based on only the lagging indicators could be late, because of the delay.
Indicator examples
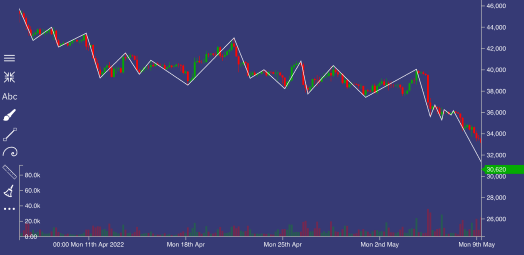
Raw market movement
Automatically detects market moves, calculates highs and lows, and plots them on the chart.
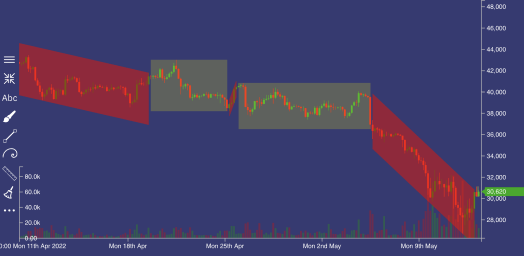
Market phases
Detecting market phases as described by the book:
If the asset forms higher highs, it is an uptrend and vice versa—if the asset forms lower lows, it is a downtrend. If these patterns are broken, i.e., lower lows in an uptrend or higher highs in a downtrend, it is an accumulation or distribution phase.
Tradiny’s algorithm is based on the raw market movement algorithm. As a result, the trend begins after the asset breaks the high/low and reaches a specified threshold depending on volatility, which makes it a leading indicator. Traders are advised to wait for the pull back after the trend forms (i.e., high/low is broken).
When comparing the raw market movement algorithm to the other algorithms based on highs and lows (e.g. Zig Zag), our algorithm does not consider the time period of a movement to be significant, but rather the size of price moves. As a result, a trader, who is using the other algorithms, can catch the beginning of a trend after some time, but with our algorithm, he can catch the beginning sooner.
It helps to catch the beginning of a trend in early stages based on the raw marker movement algorithm.